
Reference
Valuation methods reference guide
Why the methods give different answers, shown on one hypothetical business with every assumption stated and every calculation shown.
- Written for
- Educators, advisers, students and owners comparing reports.
- Answers
- Which valuation method fits which business, and why do the methods give different answers?
One hypothetical business, four methods. Harbourline Joinery Pty Ltd is a fictional custom joinery manufacturer with 24 staff, operating for 15 years from leased premises. Every number on this page is an assumption made for teaching. None is market evidence, and the multiples and rates are not recommendations.
The business in numbers
| Revenue | $3,200,000 |
|---|---|
| Normalised EBITDA | $520,000 |
| Depreciation (as a proxy for sustaining capital spending) | $70,000 |
| Normalised EBIT | $450,000 |
Method 1: Capitalised maintainable earnings
When it fits: an established, profitable business whose recent earnings are a fair guide to the future. How: maintainable earnings multiplied by a capitalisation multiple that reflects the risk and growth of those earnings.
| Assumption | Low | High |
|---|---|---|
| EBITDA multiple (assumed) | 3.5 | 4.5 |
| Implied capitalisation rate | 28.6% | 22.2% |
| Enterprise value | $1,820,000 | $2,340,000 |
Limits: the answer moves $260,000 for every 0.5 change in the multiple, so the evidence for the multiple carries most of the weight. Try it in the sensitivity table.
Method 2: Discounted cash flow
When it fits: a business whose future is expected to differ from its past, or which has reliable forecasts. How: forecast free cash flow, discount each year at a rate reflecting risk, and add a terminal value for the years beyond the forecast.
Assumptions: free cash flow after tax, sustaining capital spending and working capital of $300,000 in year 1 (roughly EBITDA of $520,000, less tax at 30% on EBIT of $450,000, which is $135,000, capital spending of $70,000 and growth in working capital of about $15,000), growing 3% a year for 5 years; terminal growth of 2.5%; discount rate (after tax) tested at 16%, 18% and 20%.
| Year (at 18%) | Free cash flow | Discount factor | Present value |
|---|---|---|---|
| 1 | $300,000 | 0.8475 | $254,237 |
| 2 | $309,000 | 0.7182 | $221,919 |
| 3 | $318,270 | 0.6086 | $193,709 |
| 4 | $327,818 | 0.5158 | $169,085 |
| 5 | $337,653 | 0.4371 | $147,591 |
| Terminal value at year 5, then its present value | $2,232,864 | 0.4371 | $976,006 |
| Enterprise value | $1,962,547 |
At 20% the value is about $1,740,000; at 16% it is about $2,250,000. The terminal value is 50% of the total at the middle rate, which is typical of why DCF conclusions are sensitive to long-run assumptions. The middle DCF value implies an EBITDA multiple of 3.77.
Method 3: Net assets and orderly realisation
When it fits: asset-heavy or marginally profitable businesses, as a floor or cross-check, or when the business is not viable as a going concern.
| Item | Going concern | Assumed recovery | Orderly realisation |
|---|---|---|---|
| Plant and equipment (assessed market value) | $640,000 | 65% | $416,000 |
| Stock | $210,000 | 50% | $105,000 |
| Trade debtors | $380,000 | 90% | $342,000 |
| Less: trade creditors | -$260,000 | In full | -$260,000 |
| Less: employee entitlements | -$95,000 | In full | -$95,000 |
| Less: realisation costs (selling costs, redundancy and notice, lease exit and make-good; assumed) | -$50,000 | ||
| Total | $875,000 | $458,000 |
The $50,000 is a simplified assumption. A real close-down of a business with 24 staff in leased premises would usually cost more once redundancy pay, notice, lease exit and make-good are costed in full.
Method 4: Market evidence
When it fits: where completed sales of genuinely comparable businesses are available with known terms and the same earnings definition. How: derive multiples from those sales, adjust for differences, and apply them. This page shows no market multiples because we would have to invent them. Read how much weight completed sales, asking prices and opinions deserve and the Business Value Monitor methodology.
Comparing the results
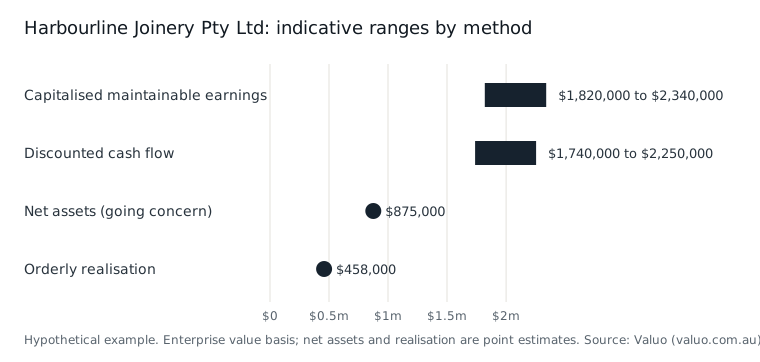
- The earnings methods agree broadly ($1,820,000 to $2,340,000 capitalised; $1,740,000 to $2,250,000 by DCF), because the DCF assumptions were set to be consistent with the multiples assumed: the middle DCF value implies an EBITDA multiple of 3.77, inside the 3.5 to 4.5 range.
- Net assets of $875,000 sit well below the earnings values: the difference, about $1,200,000 at the middle capitalised value, is goodwill and any other unrecorded intangible assets. See what goodwill is.
- Orderly realisation of $458,000 is the floor if the business stopped trading.
- A valuer would not average these figures. They would choose the primary method that fits the business and use the others as cross-checks, explaining any gap.
Which method fits
| Situation | Usual primary method | Useful cross-check |
|---|---|---|
| Stable, profitable, established | Capitalised maintainable earnings | DCF; comparable sales if reliable |
| Growing fast or changing | DCF | Capitalised earnings on forecast earnings |
| Asset-heavy, modest profits | Net assets | Capitalised earnings, to test for goodwill |
| Loss-making, not viable | Orderly realisation | None may apply |
| Early-stage, pre-profit | DCF or scenario analysis, if forecasts have reasonable grounds | Recent arm's-length capital raisings |
Cite or reuse this page
Valuo Insights team (2026). Valuation methods reference guide. Valuo. https://valuo.com.au/insights/reference/valuation-methods/ (updated 14 November 2026).
Quote short passages with attribution and a link to this page. Charts and tables created by Valuo may be republished unchanged with the credit "Source: Valuo (valuo.com.au)" and a link. Third-party sources keep their own terms. See the reuse terms.